The National Education Association – the largest teachers union in the country – blasted this out everywhere right before the November election:

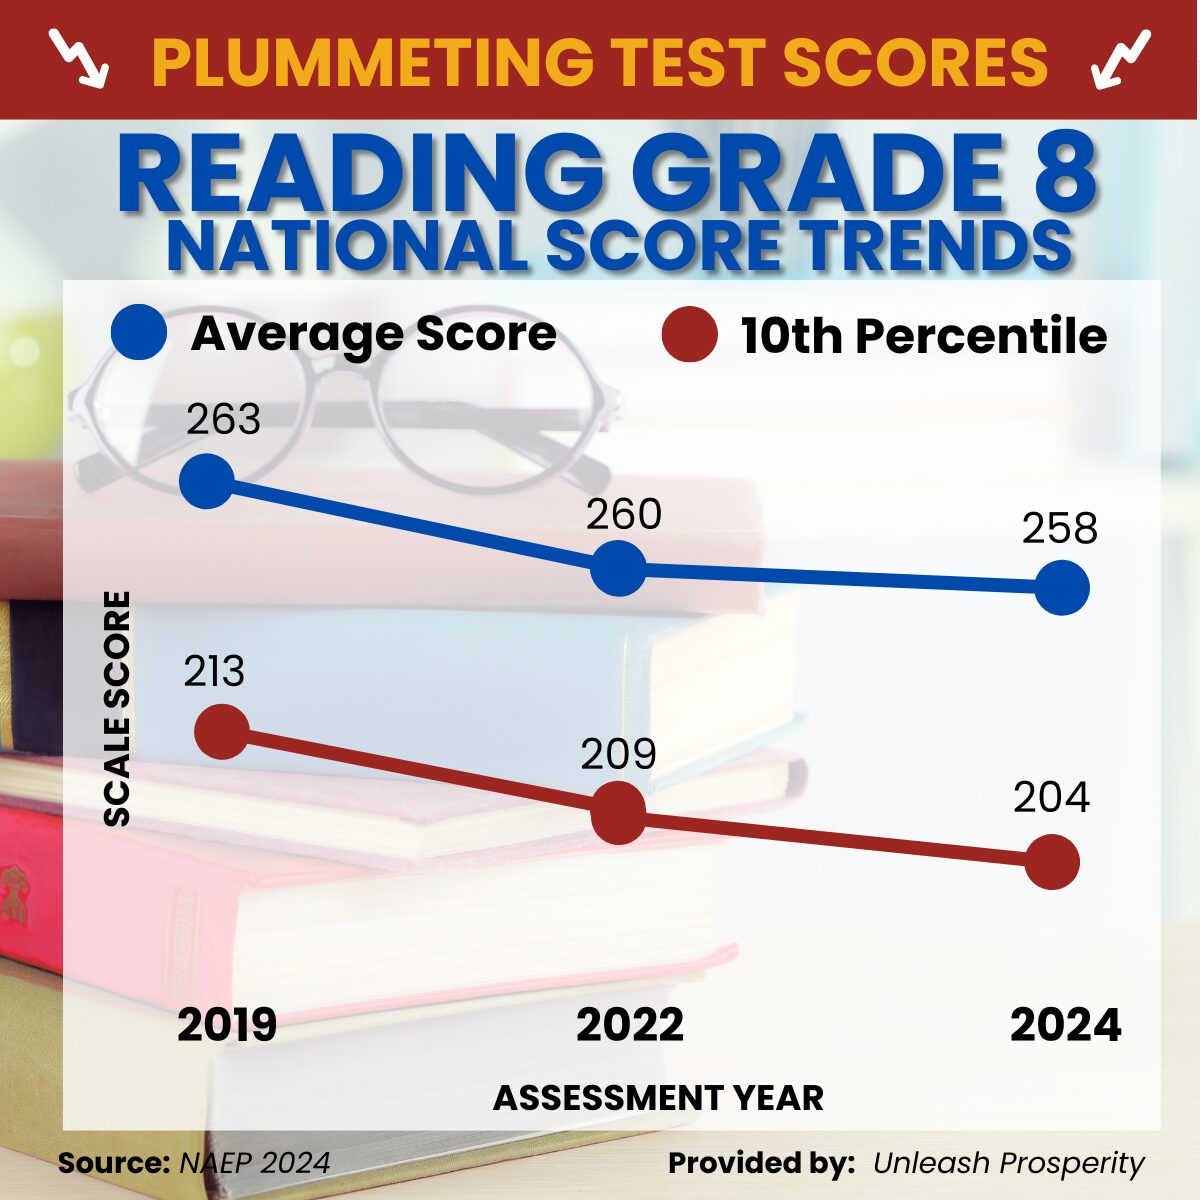
How did that “investment” turn out? Here are the test results:
What this is telling us is the more money Washington spends on schools, the worse the performance. Good job, Joe.
Just think of how many tens of thousands of kids could have been rescued from failing schools if this $170 billion had gone directly to the parents to choose great Catholic or other private schools in their neighborhood.
Oh, and by the way, how can the kids be expected to learn to spell when the teachers can’t?
(Look closely at the NEA Today headline!)
CLARIFICATION: The bottom line on the first chart above was originally labeled “poorest students” but has been clarified to “10th percentile.” By poorest we meant lowest performing — not those poverty status — but some readers were misled.
Eagle-eyed reader Dave Trabert of Kansas Policy Institute not only flagged the issue for us, but submitted to us this chart of 8th grade reading scores split by economically disadvantaged status, based on who qualifies for free or reduced lunch:

Dave notes:
As explained in my new book – 8 Things to Know about Running for School Board – 10 points on NAEP is considered a year’s worth of learning…so the 25-point gap in 2024 means that low-income 8th-graders are about 2.5 years behind their more affluent classmates.
That’s 2.5 years behind the average – and the average is pretty terrible to start with. More evidence that low-income families, especially, need school choice.


