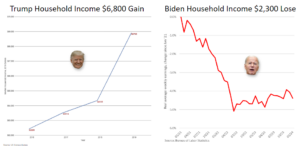
Each week we will highlight a graphic from our forthcoming Trump vs. Biden chart book. This week’s contrasts the income gains during Trump’s first three years in office with Biden’s three-year performance. The bottom line: real median household income rose by more than $6,000 under Trump and fell by more than $2,000 a month under Biden. That’s a giant $ 8,000-a-year swing.
Perhaps the reason people keep saying to pollsters they are worse off under Biden’s big government policies versus Trump’s “Put America First” policies is because most people really are.