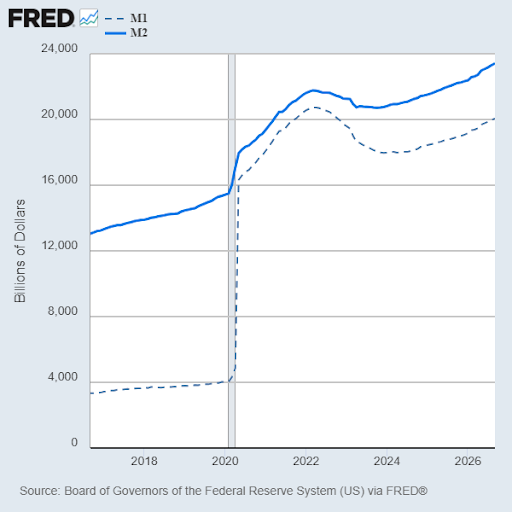
Several super smart HOTLINE readers caught an error in an item we ran last week. We ascribed much of the inflation in this decade to the money printing during COVID lockdowns, and we supported that by showing a chart of the massive growth in the M1 money supply in 2020.
It IS true that money-printing and trillions of dollars of federal debt spending WAS the match that lit the inflation fire. But the chart we ran was misleading. Most of the increase in M1 was due to a redefinition of M1 which added savings deposits to M1 – as many of our attentive readers brought to our attention.
Here is how the Fed explains it:
On April 24, 2020, the Federal Reserve Board announced that Regulation D would no longer impose limits on the number of transactions or withdrawals permitted on savings deposit accounts… the modification… rendered savings accounts almost indistinguishable from checking accounts from the perspective of depositors and banks. Accordingly, the composition of M2 between M1 and non-M1 components conveys little economic information.
The UP team members responsible for this error have been flogged and quarantined.
The real money-printing spike is seen in the rise of M2. M2 in addition to cash includes checking deposits, and other deposits readily convertible to cash, such as CDs. As this chart shows, M2 rose rapidly, but not as steeply as M1.