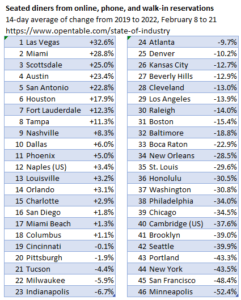
Here’s an update on the OpenTable restaurant data we’ve featured before. This chart compares seated diners at a consistent sample of restaurants the past two weeks to the same time period in 2019. The cities at the top of the list are booming. The bottom are still in a deep freeze – with diners scared off by crime, COVID rules, etc. Notice any patterns?

