Richard Salsman of Intermarketforecasting.com, who puts out a great stock newsletter, notes that “today’s yield curve at -161 basis points is as steeply negative as it has been in decades.” As his chart below shows, the 10-year T-Bond yield is at 3.72% and the 3-month T-Bill rate stands at 5.33%.
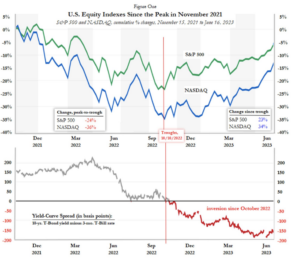
What is interesting about the chart is that when the yield curve turned negative stocks went on their current rally. The major stock indices are up roughly 20% this year with the Nasdaq even higher, though stocks are still lower than their November 2021 highs. When adjusting for inflation, stock returns have been negative under Biden.
The conventional wisdom is that the inverted yield curve means that investors have turned bearish and risk-averse, and thus the flight to the safety of long-term bonds – which drives down the interest rate.
Maybe. But, as we’ve pointed out before, there is little question that the very low 10-year T-bill interest rate of 3.72% is the market forecasting low inflation for the decade to come. If you thought inflation was going to stay above the 4 to 5% range, would you buy a 10-year bond at a 3.7% interest rate? You’d be a fool if you did.
Inflation is still likely to stay above the Fed target of 2%, but the problem going forward is anemic growth. An economy that should be growing at 3% has been limping forward for the past year and a half at closer to a measly 1% and real household income is negative.
What scares us is that the Biden/Bernie Sanders game plan is to add even more government spending aimed at income redistribution and pay for it with higher tax rates on the rich. That is dangerously misguided and exactly what will happen if the Democrats sweep in 2024.