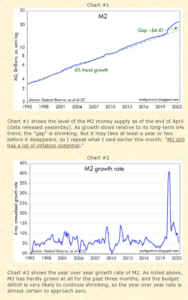
One of our favorite financial analysts, Scott Grannis, has been tracking the growth of the monetary base since the start of the pandemic.
The charts below show that almost all of the excess spending – some $4.6 trillion over the past 30 months – was monetized. In other words, we paid for the spending almost exclusively by the Fed printing money.
Is it any surprise that inflation hit a near 40-year high this year with all the pandemic spending in 2000 under Trump and then Biden’s $3 trillion of added spending?
Biden denies that his spending blitz led to inflation, but these pictures show fairly conclusively the relationship between massive debt spending and the tidal wave of higher prices.
The good news is that because the absurd Build Back Better appears dead (notwithstanding Manchin’s latest lovefest in Davos), spending is starting to decelerate and this should mean somewhat lower inflation in the months ahead. But we are still looking at between 4 and 6% inflation over the next year – at least.

