Whether the 2020 Census was accurate or not, a lot has changed in just a few years since then.
The National Populist Newsletter posted a map to Substack recently that vividly illustrates the wide variation in population growth between the states and DC from the 2020 Census (April 1, 2020) to July 2023:
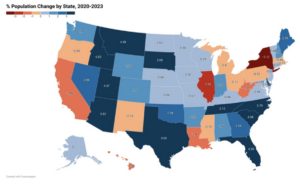
It’s almost identical to the map we showed yesterday–except the shrinking states are the ones the unions claim are the best places to work. Isn’t that interesting?
On a percentage growth basis, Idaho led the nation with an increase of 6.83%. Six other states gained between 4.0% and 5.0% (in order), South Carolina, Florida, Texas, Montana, Utah, and Delaware. Each of these states, except for Delaware voted red in the 2020 election.
The largest percentage loss was in New York, at minus 3.12%. Five states and DC exceeded losses of 1.0%, (in order), Illinois, Louisiana, the District of Columbia, California, Hawaii, and West Virginia (yes California lost a larger percentage than West Virginia). Each of these states and DC, except for Louisiana and West Virginia voted blue in the 2020 election.
The fastest growing states in actual numbers were Texas (1.358 million) and Florida (1.073 million), Each of these two states gained more population than the other 48 states and DC, which together gained 1.020 million. The two states accounted for 71% of the US population growth.
